Making Chloropleths from NYC Parking Tickets Data
2016-11-19
From June 2013-September 2016, more than 30M parking summons were issued in New York City. In a jupyter notebook in the github repo for this analysis, I show how to create maps of this data, using data from the NYC Open Data portal (hosted by Socrata), Pandas, and Folium.
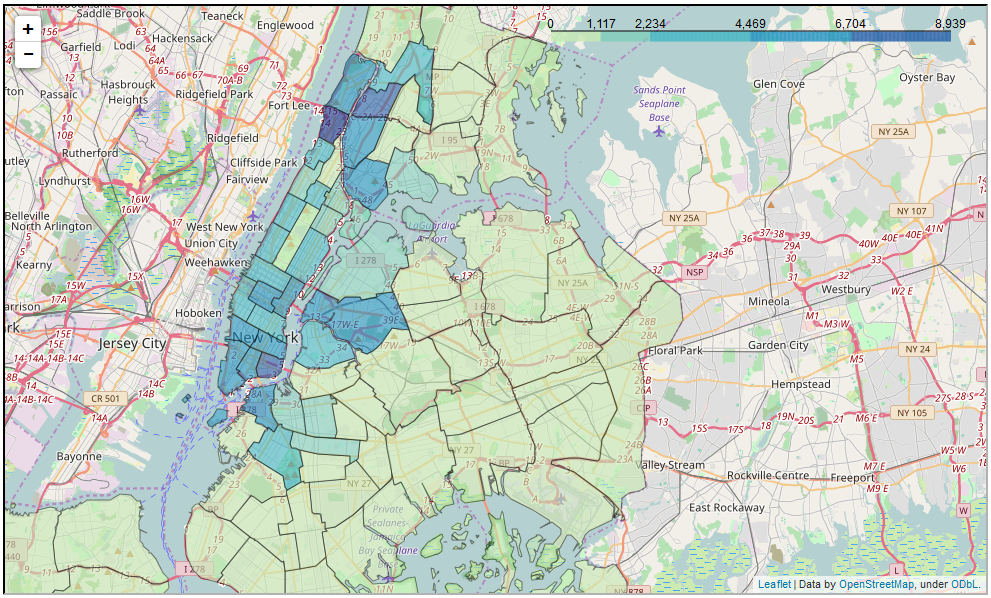
Here's an example choropleth (same choropleth as in notebook), for the total number of summonses given in each NYC precinct for "Stopping, standing or parking within a marked bicycle lane" in 2014 and 2015:
Let's dive in. Working with the parking ticket data had a few steps:
Step 1: Reading the Data
First I pulled the data from the NYC Open Data Portal on an number of offenses of offense type, in each precinct, on each day basis.
Reading the datasets is attempted two ways—first using the pandas library to read the results of the analysis directly into a dataframe using pandas' json function, and, if that doesn't work, using the base urllib package to create a list of dictionaries that are then transformed to a pandas dataframe.
The datasets are aggregated using Socrata's select, group, and limit statements from SoQL (Socrata Query Language), Socrata's SQL-like syntax for working with data directly from Socrata's API. There are a lot more Socrata QL params, all SQL-like, that can be added as well.
Step 2: Cleaning the Data
A lot of data cleaning need to be done before I could create the maps, especially because the ticket information is first taken down with pen on paper by an officer and then later digitized. Among the operations I needed to take:
- Summons with undefined violations (violation code 36) are removed.
- Dates are changed to '%Y-%m-%d' format.
- Violation counties are cleaned up and grouped into the official county codes of 'NY' (Manhattan), 'BX' (Bronx), 'K' (Kings/Brooklyn), 'Q' (Queens), and 'R' (Richmond/Staten Island).
- Violations with clearly mismarked precincts or dates (e.g. the precinct marked in the violation does not exist or the date is from before July 1, 2013 or from a date in the future) are filtered out of the dataset.
Additionally, data on each violation type, like ticket cost and violation descriptions, were added to the dataset by joining our the dataframe for the main dataset with a violation type level dataset, which I downloaded from the NYC Open Data portal and cleaned up for illegal characters. This allowed me to determine daily revenue from each offense type in each precinct, by multiplying number of offenses by cost of a summons for that offense.
Step 3 : Creating the Maps
The last step was writing a function to create choropleths using the Folium package (a python wrapper of the Leaflet Javascript library). I wrote a create_choropleth function that includes data for a color scheme, for where the map should be centered, and for what columns from the dataframe created from the aggregate function should be used. Information for drawing the boundaries of the precincts is from the query.json file (actually geojson), which is also from the NYC Open Data Portal and is saved in this github repo. Each precinct's shape from the geojson file is matched with information on the precinct by matching the prencinct's 'feature.properties.Precinct' parameter in the precinct boundaries geojson file with the column listing precinct number in the dataframe created from an aggregation function I wrote that allows the user to get precinct-level information on offenses—e.g., number of offenses of offense type(s) or revenue from offenses of offense type(s)—by customized date range and offense type.
So, What Next?
Good question! I'd like to see what we can learn about New York City from maps made from publicly-available data, or to use the other functions to easily create aggregations that can then be analyzed. I'm looking forward to doing more with this interesting data set, and invite you to build on the code in the jupyter notebook and extend upon it.
Tags: python, civic tech, data science, socrata, nyc, open data